Introduction to Measurement System Analysis
A statistical tool called measurement system analysis can be used to evaluate a measurement system’s level of quality. It checks the precision and dependability of the measurement system in use and guarantees the validity and accuracy of the gathered data. MSA is utilized in sectors like manufacturing, healthcare, and research and is a crucial stage in quality control.
What is MSA?
Measurement System Analysis is referred to as MSA. It is a statistical instrument used to examine the accuracy and dependability of a measuring system to determine its quality. MSA assists in locating and removing measurement error causes and ensures the validity and accuracy of the data gathered. It is utilized in many different industries, including manufacturing, healthcare, and research, and it is a crucial stage in quality control.
Importance of Measurement System Analysis
Any process that involves measurement must be precise in order to provide quality control and process improvement. Products with defects, higher expenses, and worse customer satisfaction can result from a measurement system that is neither accurate nor dependable. A method called Measurement System Analysis (MSA) is used to assess the stability, accuracy, and precision of a measurement system. In this post, we’ll look at how crucial MSA is for assuring precise measurements, lowering variability, and enhancing overall quality control.
Goal of MSA
The goal of MSA is to guarantee the accuracy, dependability, and consistency of a measurement system. It aids in the quantification of measurement errors, the identification of various sources, and the enhancement of process quality in general. By assessing the measuring system, MSA contributes to ensuring that the information gathered is reliable and suitable for decision-making.
Benefits of Measurement System Analysis
1. Improved Quality Control
MSA contributes to process quality improvement by locating sources of variation and calculating measurement errors. It guarantees that the information gathered is trustworthy and suitable for use in making judgments.
2. Reduced Costs
Increased expenses from rework, scrap, and customer returns can be brought on by measurement inaccuracy and unpredictability. MSA assists in lowering costs and raising a process’s general efficiency by detecting and resolving these problems.
3. Increased Customer Satisfaction
Accurate measurements have a direct impact on the quality of the given good or service. The precision and dependability of the measuring system are improved by MSA, which also raises client satisfaction levels in general.
Types of Measurement System Analysis
There are two types of MSA:
1. Attribute MSA
When the data being collected is categorical, such as pass/fail, good/bad, or yes/no, attribute MSA is utilized. It assesses if the measurement system consistently yields the same findings for the same property.
2. Variable MSA
When collecting continuous data, like that on weight, height, or temperature, variable MSA is employed. It assesses if the measurement system consistently yields the same findings for the same variable.
Steps involved in conducting an MSA
- Planning the Study
- Selecting the Parts to Measure
- Selecting the Operators
- Conducting the Study
- Analyzing the Data
- Drawing Conclusions
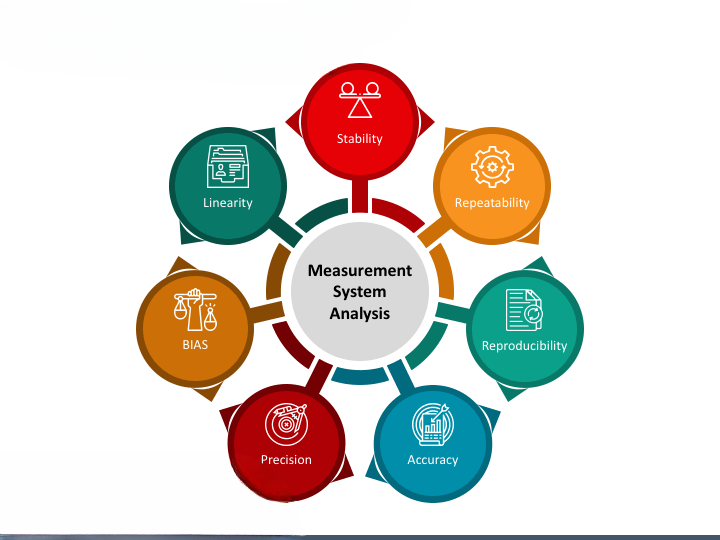
MSA Metrics
- Bias
- Linearity
- Stability
- Repeatability
- Reproducibility
- Gage R&R
1. Bias.
Bias is the difference between the average of the measurements and the true value Several things, including calibration mistakes, environmental issues, and operator mistakes, might lead to bias. Inaccurate choices and actions can result from bias in a measurement system, which reduces its accuracy.
Bias =Bias = Σ (Measured Value – Reference Value) / n
Where:
- Σ is the sum of the differences between the measured values and the reference value
- n is the number of measurements
2. Linearity
A measurement system’s linearity refers to its capacity to produce readings that are across a given range directly proportionate to the true value. A linear measuring system ensures the measurements are dependable by producing results that are reliable, predictable, and consistent.
Linearity = 1 – (Σ|Measured – Expected| / n * Range)
Where:
- Σ is the sum of the absolute differences between the measured and expected values
- n is the number of measurements
- The range is the difference between the highest and lowest input values
3. Stability
The ability of the measurement system to deliver reliable data over time is referred to as stability. In order to ensure that the measurements are consistent, a stable measurement system is necessary.
4. Repeatability
The degree to which a measurement may be repeated under the same circumstances with the same measurement tools and operator is known as repeatability. To put it another way, how closely would two measurements of the same thing taken by the same person using the same tools and methods compare to one another? The degree of consistency a measurement system has within itself is measured by its repeatability.
5. Reproducibility
The degree to which a measurement can be repeated under various circumstances, such as with multiple measurement tools or operators, is known as reproducibility. In other words, how closely will measurements taken by several individuals using various tools or methods of the same object compare to one another? The degree of a measurement system’s consistency under various settings is known as reproducibility.
6. Gage R&R
A statistical method called Gauge R&R (Gauge Repeatability and Reproducibility) is used to evaluate the measurement system variability in a manufacturing or quality control process. It is a sort of measurement system analysis (MSA) that assesses the repeatability and reproducibility of a measurement system and establishes the proportion of variance attributable to the measurement system versus that attributable to the product being measured.
The following steps are commonly included in the Gauge R&R process:
- Choosing the proper measuring device.
- Choosing the proper attribute to measure for a product or process.
- Figuring out how many operators and tests the study will need.
- Gathering measurement information from the operators.
- Statistical methods are used to analyze the data and identify the variation caused by the product being monitored as well as the variation caused by the measurement device (repeatability and reproducibility).
- Analyzing the findings and, if necessary, making judgments about how to improve the measuring system.
Why Perform MSA?
Measurement System Analysis (MSA) is crucial for a number of reasons:
1. Quality Control
The measurement system’s ability to produce accurate and trustworthy results is ensured by MSA. Quality control and process optimization make it easier to locate the causes of variation and to calculate measurement errors.
2. Cost Saving.
Cost savings Costly mistakes, such as scrap, rework, and customer complaints, might result from an imprecise measurement system. An MSA can help you find and remove causes of measurement errors, which can save costs and increase productivity.
3. Decision Making
Making decisions: Reliable measurements are necessary for making well-informed choices. Inaccurate measurements could result in poor product quality, inefficient business processes, and higher expenses if the measurement technology is inaccurate. For the measuring system to produce accurate and trustworthy data, which is necessary for making good decisions, MSA helps.
4. Continuous Improvement
MSA is a continuous process that can assist in locating chances for continued improvement. It is possible to develop data-driven innovations that can result in higher product quality, enhanced processes, and increased efficiency by monitoring the measurement system and locating sources of variance.
How to Perform MSA?
MSA involves several steps, including planning, conducting the study, analyzing the data, and interpreting the results
Step 1: Planning
Planning the study is the first step in carrying out an MSA. This includes specifying the study’s goal, picking the proper MSA type, and choosing the measuring tools and staff to be employed. It’s crucial to check that the measurement tools are accurate and in good working order. It is also necessary to identify the number of operators and measuring parts.
Step 2: Conducting the Study
Conducting the study is the next stage after planning it. Measure the components using the chosen measurement system, then gather the data. To prevent bias, it is best to measure the components in random order. To evaluate the repeatability of the measuring system, each operator should measure each component several times.
Step 3: Analyzing the Data
Data analysis follows data collecting. This requires identifying the sources of variation as well as variance in the measurement system. Data is analysed using ANOVA, control charts, and histograms
Step 4: Interpreting the Results
The results of the MSA must be seen as the last step. If the measurement system is able to generate precise and accurate data will be determined by the MSA results. Improvements should be made to the measurement system if the results show that it is insufficient. Calibration of the machinery, staff training, or the choice of a new measurement method are a few examples of improvements.
Tips for Performing MSA
Here are some tips to help you perform MSA effectively:
- Include everyone who will be affected by the study in its preparation and execution.
- Make that the measurement tools are in good working order and calibrated.
- Use enough components and operators to produce reliable results.
- To prevent bias, randomize the parts’ order.
- Analyze the data using statistical tools to find sources of variation.
- Interpret the findings and, if necessary, take corrective action.
The variable vs Attribute data classifications
1. Variable Data
Data that can be measured and quantified is referred to as variable data. Length, weight, and temperature are a few examples of changeable data. In most cases, continuous variables can take on any value within a given range. For instance, a room’s temperature can range from 68 to 72 degrees Fahrenheit.
The analysis of variable data frequently employs statistical techniques. These techniques involve figuring out the data’s mean, standard deviation, and variance. These computations can provide light on the data’s distribution and aid in the detection of any outliers or abnormalities.
2. Attribute Data
On the other hand, attribute data refers to information that cannot be measured or quantified. Instead, quality or qualities are frequently used to define attribute data. The attributes of color, gender, and product type are a few examples.
Comparing attribute data to variable data calls for a different method of analysis. Instead of statistical procedures, tools like Pareto charts or fishbone diagrams are frequently used to analyze attribute data. These instruments assist in locating the underlying reasons for any problems or flaws within
The Procedure of MSA: Gage R&R Study
The MSA (Measurement System Analysis) is an important process in ensuring accurate and reliable measurements in any manufacturing or quality control environment. One aspect of MSA is the Gage R&R (Repeatability and Reproducibility) study, which is used to evaluate the measurement system’s capability and identify potential sources of measurement error
1. Select the Parts to Measure
Choosing the components to measure is the first step in a Gauge R&R study. All of the qualities that are essential to quality should be present in these components, which should represent the complete process.
2. Select the Appropriate Gage
A suitable gauge must then be chosen to measure the parts. The gauge should be able to precisely and correctly measure the unique characteristics of the parts. To maintain consistency, it’s crucial to use the same gauge throughout the entire investigation.
3. Define the Measurement Process
It is important to establish the measurement process in detail, including the precise steps to measure the parts and record the data. All operators must comprehend the procedure and adhere to it consistently, therefore this must be ensured.
4. Conduct the Study
In the Gauge R&R study, identical parts are measured repeatedly with the same gauge and different operators. To make sure that the findings are accurate representations of the process, the study should be carried out in typical working settings.
5. Analyze the Results
The data should be examined when the study is over to ascertain the measurement system’s repeatability and reproducibility. Repetition is the difference between measurements made by the same operator using the same gauge. The term “reproducibility” describes the variance in measurements made by various operators using the same gauge.
6. Interpret the Results
The results must be interpreted in order to determine whether the measurement system needs to be modified. The measurement system is viewed as capable if the repeatability and reproducibility are within acceptable bounds. It is necessary to improve the measurement system if the results fall outside of permissible bounds.
A Gauge R&R study is a critical tool for assessing a measuring system’s performance and locating potential sources of measurement inaccuracy, in light of the foregoing. Accurate and trustworthy measurements can be made in any production or quality control setting by following the six-step technique described above.